Scientific Visualisation
Computer graphics makes vast quantities of data accessible.
Numerical simulations frequently produce millions of data values. Similarly,
satellite-based sensors amass data at rates beyond our abilities to interpret
them by any other means than visually. Mathematicians use computer graphics
to explore abstract and high-dimensional functions and spaces.
Physicists can use computer graphics to transcend the limits of scale. With
it they can explore both microscopic and macroscopic worlds.
From scientific visualisation to information visualisation
Image processing
From satellite camera
Analysing large amount of information (from real input or from simulation)
From geological data, data with intrinsic spatial signification
Visualising model
From mathematics, chemistry
Sorting out information from data
abstract data and hierarchical data
From understanding to explanation
|
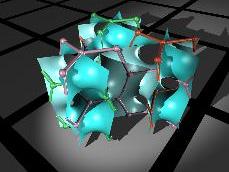
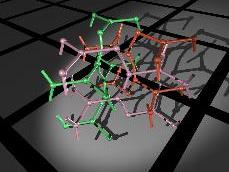
Triply connected graph embeddingsMinimal Surface graph embeddings resulting in interlocking disconnected
lattices
|
|
|
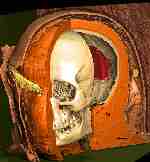
"The mummy is back"The Virtual MummyUnwrapping a Mummy by Mouse Click
|
||
As seen in "Jurassic Park"!3D File
System Navigator for IRIX 4.0.1+
|
||


