The images and text in this section are from the 1993 ACM SIGGRAPH Education Slide Set (Rosalee Nerheim-Wolfe, editor) and were produced by the following:
Storyboard and Production: Rosalee Nerheim-Wolfe
Raytracing program: Cynthia Gryniewicz and David Abramoske
Artistic Director: Jenny Morlan
Please click on the images to go to the next one.
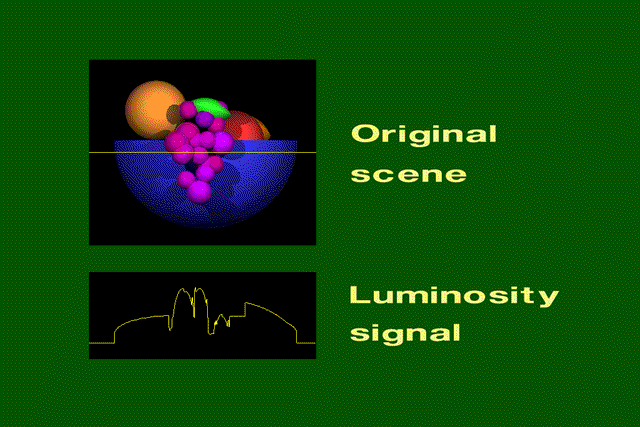
The bowl of fruit was modeled using constructive solid
geometry(CSG).
One scanline in the fruitbowl is highlighted. The graph shows the luminosity (brightness)
function of the highlighted scan line.
The rectangular grid superimposed over the fruit bowl shows the size of the pixels. The dot in the middle of each square shows the position of a sample. The color at the sample point will be the color of the pixel in the rendered image. The graph shows the corresponding sampled luminosity function of the highlighted scanline. Notice that a lot of information has been lost.
The rendered image differs greatly from the original scene, as does the luminosity signal. Notice that the green leaf has moved to the right in the rendered image.
The errors caused by aliasing are called artefacts. Common aliasing artefacts include jagged profiles, disappearing or improperly rendered fine detail, and disintegrating textures.
The picture on the left shows the sampling grid superimposed on the original scene. The picture on the right is the rendered image. A jagged profile is quite evident in the rendered image. Also known as "jaggies", jagged silhouettes are probably the most familiar effect caused by aliasing. Jaggies are especially noticeable where there is a high contrast between the interior and the exterior of the silhouette.
The original scene on the left shows a group of small polygons. In the rendered scene, one of the two red rectangles disappears entirely, and the other doubles in width. Two of the orange triangles disappear. Although the two yellow triangles are identical in size, one is larger than the other in the rendered image.
This is a checkered texture on a plane. The checkers should become smaller as the distance from the viewer increases. However, the checkers become larger or irregularly shaped when their distance from the viewer becomes too great. Simply increasing the resolution will not remove this artefact. Increasing the resolution will only move the artefact closer to the horizon.
Antialiasing methods were developed to combat the effects of aliasing. The two major categories of antialiasing techniques are prefiltering and postfiltering.
Prefiltering methods treat a pixel as an area, and compute pixel color based on the overlap of the scene's objects with a pixel's area.
The original scene is a filled orange circle on a red background. All of the pixels inside the circle are 100 percent orange. All the pixels on the boundary of the circle have some area that is red and some area that is orange. Forty percent of the highlighted pixel is orange and 60 percent of its area is red. The computed color for the highlighted pixel is 40 percent orange and 60 percent red.
Both phrases were rendered at a resolution of 512x512. Even at this resolution, the jaggies are apparent in the phrase that hasn't been antialiased.
Without antialiasing, the jaggies are harshly evident.
Along the character's border, the colors are a mixture of the foreground and background colors.
Postfiltering, also known as supersampling, is the more
popular approach to antialiasing. For each displayed pixel, a postfiltering
method takes several samples from the scene and computes an average of the samples
to determine the pixel's color. The two steps in the postfiltering process are:
1. Sample the scene at n times the display resolution. For example, suppose
the display resolution is 512x512. Sampling at three times the width and three
times the height of the display resolution would yield 1536x1536 samples.
2. The color of each pixel in the rendered image will be an average of several samples.
For example, if sampling were performed at three times the width and three times the
height of the display resolution, then a pixel's color would be an average of nine
samples. A filter provides the weights used to compute the average.
In both figures, the display resolution is four pixels wide by three pixels high. The superimposed grid depicts the size of a pixel. Both figures show supersampling at three times the height and three times the width of the display resolution. In the right figure, the samples are regularly spaced. In the left figure, the positions of samples are displaced by a random amount. The random amount is small relative to the size of the pixel. This method of perturbing the sample positions is known as "jittering." Jittering adds noise to the rendered image. The advantage of jittering is that the human eye tolerates noise more easily than it tolerates aliasing artefacts, and as a result, humans perceive a higher quality in the rendered image.
Filters combine samples to compute a pixel's color. The weighted filter shown on the slide combines nine samples taken from inside a pixel's boundary. Each sample is multiplied by its corresponding weight and the products are summed to produce a weighted average, which is used as the pixel color. In this filter, the center sample has the most influence. The other type of filter is an unweighted filter. In an unweighted filter, each sample has equal influence in determining the pixel's color. In other words, an unweighted filter computes an unweighted average.
[ Go to Part 1] [ Go to Part 2 ]
On the left is a group of samples that will be combined to produce pixel colors. Some of the samples are orange, and some are red. The superimposed numbers are the weights from the filter shown in the last slide. The highlighted group of samples on the left are combined using the filter to produce the color of the highlighted pixel on the right.
Students incorporated several postfiltering techniques in a raytracer. All of the following raytraced images were rendered at a resolution of 512x342.
The students combined 1536x1026 regularly-spaced samples using an unweighted filter. Each of the nine samples taken for a pixel had equal influence on the pixel's computed color.
The samples are regularly spaced. Here's the weighted filter used in this rendering: 1/81 2/81 3/81 2/81 1/81 2/81 4/81 6/81 4/81 2/81 3/81 6/81 9/81 6/81 3/81 2/81 4/81 6/81 4/81 2/81 1/81 2/81 3/81 2/81 1/81 This filter allows samples taken from neighboring pixels to influence the color of the current pixel. The result is softer profiles and edges.
Each sample is perturbed by a random amount in x and y. The random amount is constrained to be less than one sixth of the pixel's width.
Tony Loza, Cynthia Gryniewicz and David Abramoske wrote the raytracing package that created slides 48-51. The raytracer is written in 'C' and runs on several Unix platforms. David incorporated the postfiltering methods, and Cynthia created the model. Special thanks to Jenny Morlan for her invaluable assistance in designing the slides. Thanks also to Ed Allemand, Steve Cunningham, Henry Harr, Steve Jost, Warren Krueger, Glenn Lancaster, Charlotte Williams and the 1992 Winter Quarter "Environmental Graphics" class for viewing the slides and making many helpful suggestions.

[ Go to Part 2 ] [ Go to Part 1 ]