eScience Lectures Notes : Introduction to Computer Graphics
Slide 1 : A survey of computer graphics
Survey of Computer graphics
The uses
Slide 2 : Intro
Computer Graphics
What computers do....
process, transform,
communicate information
Aspects of Communication
-
Origin (where does it come from?)
-
Throughput (how long will it take to get here?)
-
Latency (how long do I have to wait before something happens)?
-
Presentation (what does it look like?)
Computer Graphics is...
the technology for presenting information
Today, Computer Graphics has become the predominant form
of computer output. Even the text on most computer screens are "rendered"
using computer graphics methods, as opposed to being mechanically transferred
onto paper by an inked metal stamp.
Computer Graphics are everywhere. Here are 4 immediate
examples :
Slide 3 : Movies
Movies
If you can imagine it, it can be done with computer graphics.
Obviously, Hollywood has caught on to this. Each summer, we are amazed by state-of-the-art
special effects. More and more of these images exist only within the memory
of a computer. There seems to be no end in sight for this trend.
But we're not just talking about big budget mega-productions. There are music
videos, and spinning logos on the 6 o'clock news. Computer graphics is now as
much a part of the entertainment industry as stunt men and makeup.
The entertainment industry plays many important roles
-
Leaders in quality and artistry
There are some demanding film maker around the corner.
This is an hidden explanation
-
Not slaves to conceptual purity
This is not scientific visualisation.
-
Big budgets and tight schedules (Titanic Budget)
-
Constant reminder that there is more to CG than technology. (Good
special effect is not visible)
-
How did they do that ?
-
They define our expectations.
-
2 sides : Special effects and Animation 3D
Let's have a look at different examples
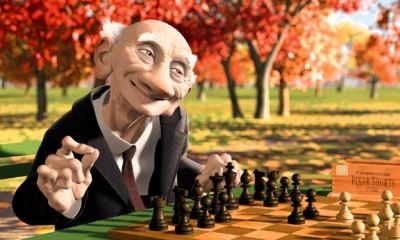 |
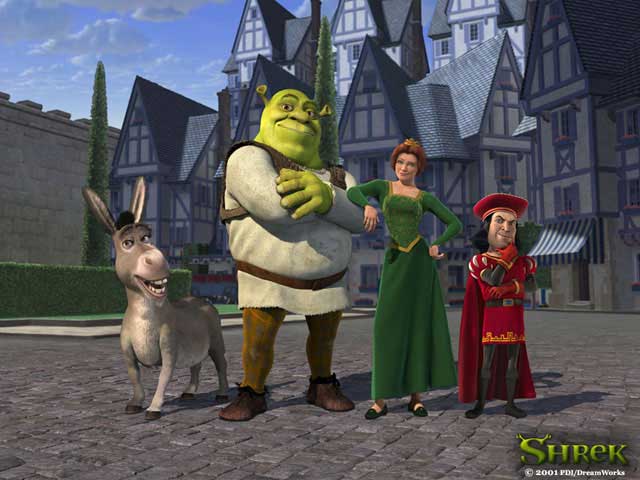
Because it is from Pixar
Luxo Jr : a desk light playing with a ball.
Luxo Jr. (1986) is the first three-dimensional
computer animated film to be nominated for an Academy Award, in
addition to winning some 20 awards at international film festivals.
It includes several technical achievements in computer animation,
most notably self-shadowing, where an image accurately casts shadows
onto itself. Final images were rendered with multiple light sources
and motion blur.
Since then : Toy Story (1995), A Bug's Life
(1998) and Toy Story 2 (1999), and soon... Monster
A name : John Lasseter (Vice President, Creative)
|
|
|
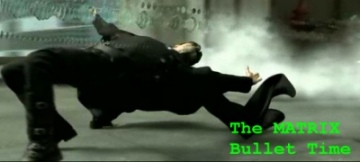
Because it is a great film.
It contains great visual special effects and
for instance, the Bullet-Time SFX.
(Invented by a French guy, first seen in a
Music Video Clip starring the "Rolling Stones")
Bullet-Time is a new visual effect which you
can find in the movie "The Matrix" and other TV commercials.
Bullet-Time was first introduced to the
general public by a swing dance commercial from Gap. It was the
first generation of the Bullet-Time effect which they got it done
poorly in the
commercial. The Bullet-Time section in the commercial was that 2
dancers jumped up, they froze, the camera started moving around
from their right
to their front and defroze their motion back to normal.Bullet-Time's
concept is to play with motion and time in video or movie. The reason
of doing that is to slow down or even freeze the time and let the
audience to see things around it more clearly at that particular
moment in time. The very basic idea is to pan the camera around
a freeze or
extremely slow moving object. In The Matrix, John Gaeta (VFX Supervisor
of The Matrix) did the camera panning with the object moving in
extremely slow motion rather than totally freeze to show us what
exactly happened around it.
|
|
|
 |
In 1994 : a new edge : Special effects could
be invisible.
Remember the feather.
The feather that we can follow in the opening
scene of "Forest Gump" is quite a good example of
invisible special effect
|
|
|
Good "making of" on the DVD.
Now you have some good excuse to go to video
ezy tonight : it will be for your study
|
 |
|
|
|
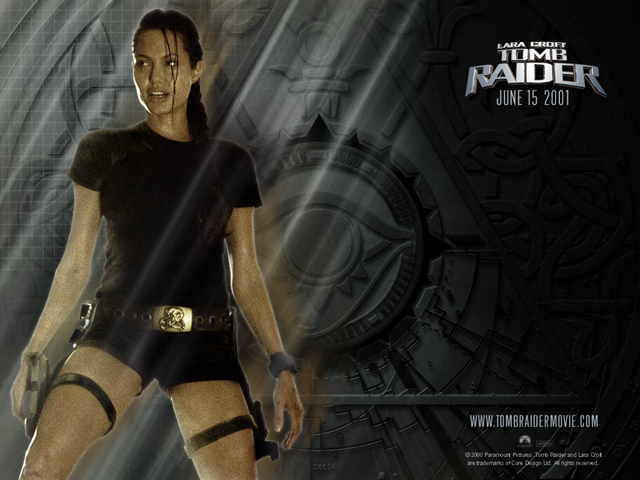
Last year exercise :
And try to figure out what
is real from what is not and imagine how they did it.
For instance, what is the next
to last special effect in Tomb raider... the butterfly
|
|
|
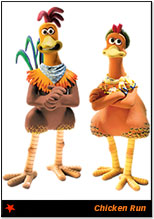
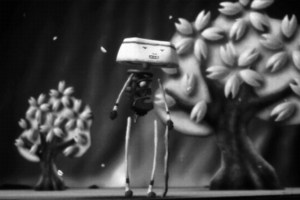
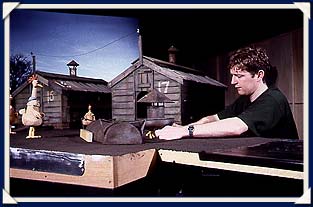
Good scenario, perfect casting, Adequate Music,...only
with modelling clay
Freely inspired from "The
Great Escape" with Steve Mac Queen (1962, by John Struges)
|
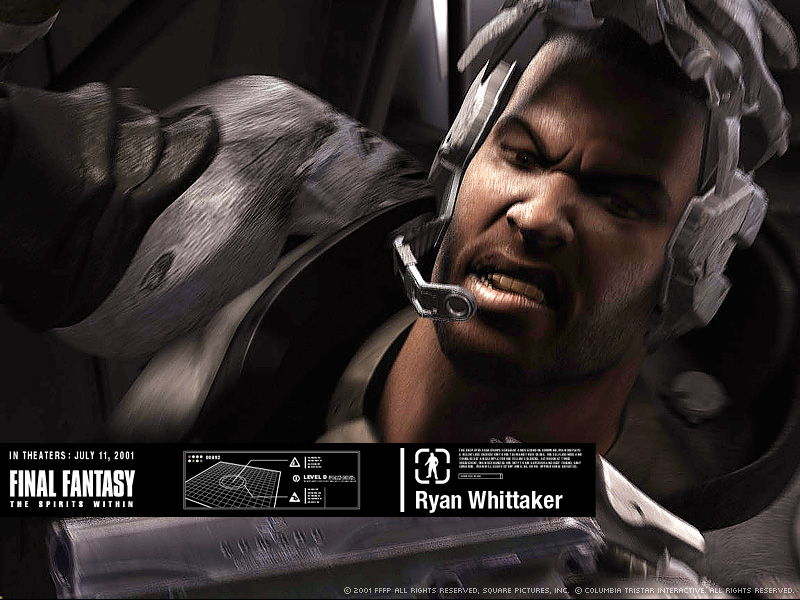
With or without computer graphics...
|
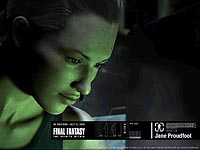
Final Fantaisy
|
New additions this year :
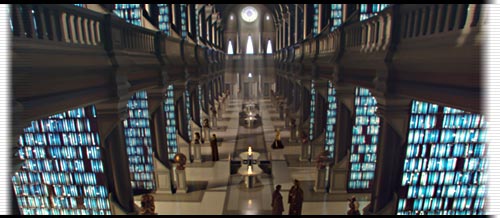
|
Star Wars II
Try to find out where is real shoting amongst
all the special effects.
If you want to buy anything from StarWars
: http://www.starwars.com/
|
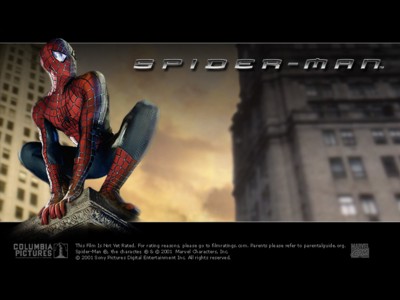
Spider-Man
This movies shows that we have all the special
effects we want... Perhaps only new stories are missing ?
|
 |
 |
Which one is a toons ?
Thank you Mr Roger R...
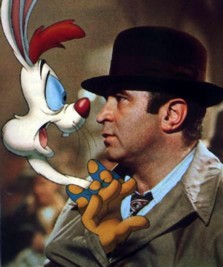
Who Framed Roger Rabbit (1988)
|
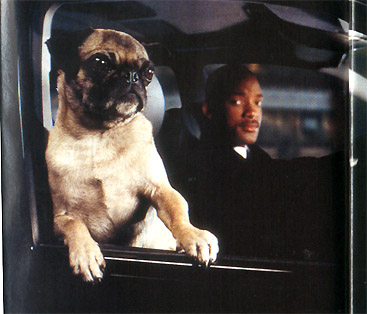
MIIB
Just have a look at the credits : half for
a usual movie team, and another half only for special effects
|
 |
|
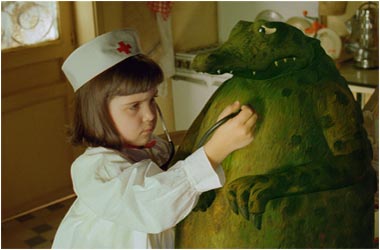
"Amelie Poulain"
by Jean-Pierre Jeunet
1991 : "Délicatessen" - (co-réalisé
avec Marc Caro)
1995 : "La cité des enfants perdus" - (co-réalisé
avec Marc Caro ; co-scénario avec Gilles Adrien et Marc Caro)
1997 : "Alien Resurrection" (Alien, la résurrection)
|
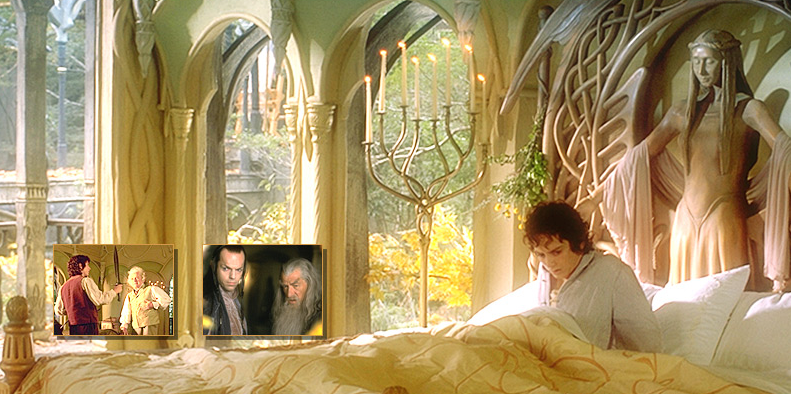
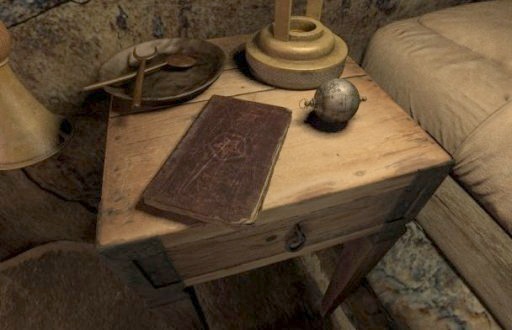
| To come... |
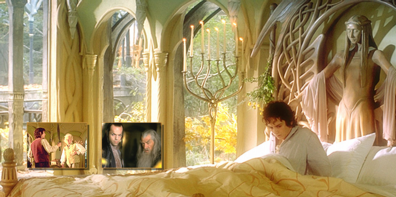
"Lord of the Rings"
Because the next one is soon (compare the
quality between the two episodes, Cf StarWars)
|
|
|
CLICK AND DRAG MOUSE
TO MOVE
PRESS SHIFT TO ZOOM IN
PRESS CONTROL TO ZOOM OUT
|
|
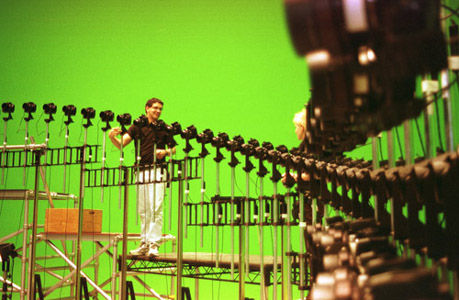
Because "The Matrix" has been the
best ScFi movie of the 90s
Because "TheMatrix" was filmed on
location in Sydney úp; on soundstages and, for two months,
on Sydney's streets and rooftops and in warehouses.
|
| |
|
|
|
CARREFUL : There is a subdirectory to explore/print : Data
Slide 5 : Games
Games
Games are an important driving force in computer graphics.
This is the second exercise. If you have time to play computer games between
now and the end of the semester ask yourselves, how do they do that? Study the
screen. How does the screen look when things are moving? What about when things
are still. Why do they always go into those low resolution display modes that
everyone else considers worthless. Let yourself get blown up. If anyone asks,
tell them you're doing science.
How the game's industry impacts computer graphics
-
Focus on interactivity
-
Cost-effective solutions
-
Avoiding computation and other tricks
-
Games drive the baseline
|
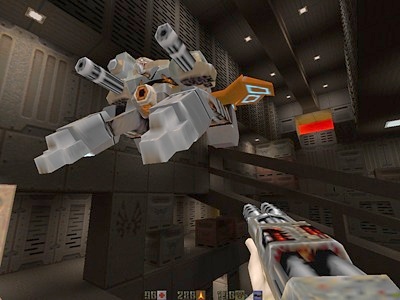
Quake : Yet Another Doom Like
|
|
|
Slide 6 : Imagina : Prix Pixel-IINA
Imagina : Prix Pixel-INA
Imagina : the forum
of images beyond imagination
Imagina, the forum of images beyond imagination, was an
event organised by INA (Institut National de l'Audiovisuel) and the
Monte-Carlo Television Festival, between 1982 and 2000
Imagina was devoted to the following fields :
- computer-generated images and automatic animation
- digital production and special effects
- games and virtual communities
- intelligent agents and extended reality
- virtual worlds and cyberspace
- webcasting
- sound synthesis
- architectural spaces
- medical scanning.
Imagina reassemble professionals on four main activities :
A Set of Papers, Panels and Workshops
convening international specialists, and dealing with
the most remarkable innovations in new image technologies and their applications
in the following fields : television, cinema, games, web, medical and architecture
;
An International Animation Festival : the 'Prix Pixel-INA'
Competition, enabling the public and a professional jury
to reward every year the best international productions using these new creative
tools
An Innovation Village, a real 'laboratory of the future'
presenting innovative installations, applications and
products which ambition is to discover new fields of experimentation and research
incorporating virtual images
An Industrial Exhibition,
The European rendez-vous of professionals in computer-generated
images, computer graphics artists, designers, artists, cinema professionals,
software editors, hardware manufacturers, industrials, service providers, researchers,
scientists, students...
Prix Pixel INA
In the space of 19 years, the "Prix Pixel-INA"
awards have become a touchstone of the state of the art and of world-wide production
in computer graphics and special effects.
Awards attributed by the audience
Art
Works with a strong artistic content and outstanding aesthetic originality.
|
|
"SAKURATEI"
Realisation : Koji MATSUOKA - LINKS CORPORATION
Production : LINKS CORPORATION - IMAGICA CORPORATION
Pays : Japan - 97
|
Schools & Universities
works by students
|
Or another example :
|
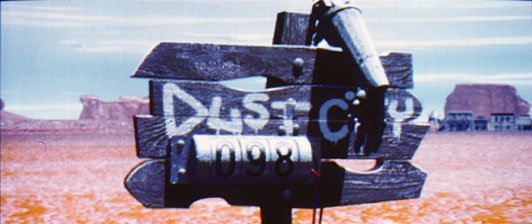
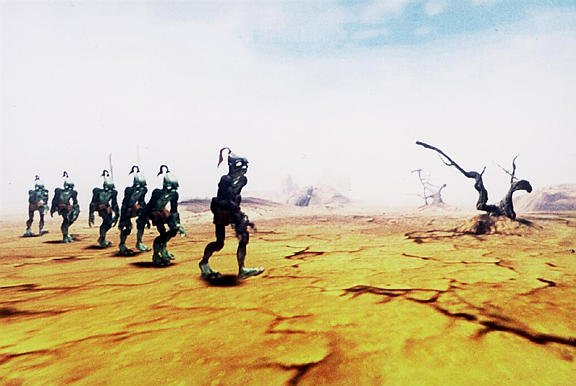
"DUST CITY"
Realisation : Sébastien DROUIN - Christophe MUTIN - Olivier DUMONT
Production : UNIVERSITE DE PROVENCE
Pays : France - 97
and below :
UN TEMPS POUR ELLE
Contact : Bruno FOLLET
HEURE EXQUISE !, France
Tél : (33) 3 20 43 24 32 - Fax : (33) 3 20 43 24 33
e-mail : exquise@nordnet.fr
Production : SUP INFO COM
Realization/Infographie : Erwin CHARRIER
Hard./Soft. : PC, Avid, 3DS Max, Photoshop, After Effects - 99
|
Cinema/television special effects
cinematographic works or videograms incorporating visual or special effects
made with
computer graphics or advanced digital processing techniques
|
|
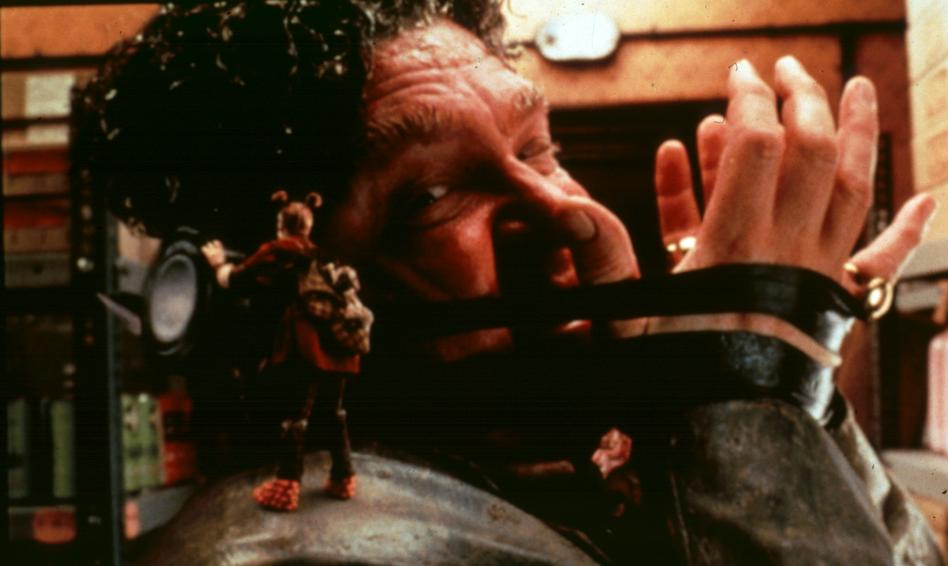
THE BORROWER
Realisation : Peter HEWITT
Effets spéciaux numériques : DIGITAL FILM
Production : DIGITAL FILM
Coproduction : WORKING TITLE FILMS
United Kingdom - 98
|
Fiction (short films and feature films)
works with a clear narrative structure
|
 |
"STICKY BUSINESS"
Realisation : Ed. TAYLOR
Production : KINGSTON UNIVERSITY
Pays : U.K - 97
96 : Toy Story
Production : Pixar, The Walt Disney Company
Réalisation : John Lasseter
Réalisation infographique : Pixar
Pays : Etats-Unis
|
Credits and channel logos
credit and logo sequences made using computer graphics
|
|
COUPE DU MONDE FIFA 98
Credits for the Soccer World Cup
Contact : Antoine LANTIERI
UN MONDE PARFAIT, France
Tél : (33) 1 41 31 50 00 - Fax : (33) 1 41 31 50 10
Production : UN MONDE PARFAIT
Réalisation : Marc TATOU, Antoine LANTIERI
Infographie : Martial VALENCHON (MAC GUFF LIGNE) - 99
Hard./Soft. : Mac, SGI, Explore, Flame, Photoshop
|
Games (intros and kinematics)
only game intros and kinematics will be judged
|
Some Outsiders
 L'AMERZONE
ODDWORLD : L'EXODE D'ABE 
 MEREMANOID
Plus, big classics Tomb Rider...
|
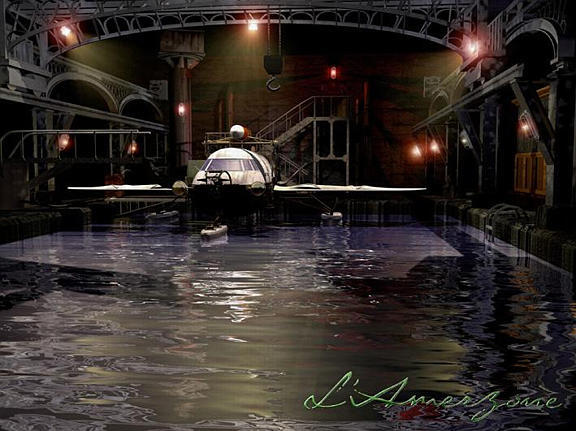
L'AMERZONE
Contact : Olivier FONTENAY
MICROFOLIE'S, France
Tél. : (33) 1 53 62 50 00 - Fax : (33) 1 53 62 50 01
e-mail : ofontenay@microfolies.com
Production : MICROFOLIE'S, CASTERMAN
Conception : Benoît SOKAL
Infographie : GRID (Belgique) - 99
Soft. : Lightwave
ODDWORLD : L'EXODE D'ABE
Contact : Cécile BORZAKIAN
GT INTERACTIVE, France
Tél. : (33) 1 43 12 31 04 - Fax : (33) 1 43 12 31 19
e-mail : cborzakian@gtinteractive.com
Production : ODDWORLD INHABITANTS (Etats-Unis)
Conception : Lorne LANNING - 99
Infographie : ODDWORLD INHABITANTS
MEREMANOID
Contact : Nicolas TROUT
MAC GUFF LIGNE, France
Tél. : (33) 1 53 58 46 46 - Fax : (33) 1 53 58 46 47
e-mail : niko@macguff.fr
Production : XING (Japon)
Conception : Pascal ROULIN - 99
Computer graphics : MAC GUFF LIGNE
Hard./Soft. : SGI, Explore, Custom, Symbor, Trukor
|
Theme parks
works specially made for theme parks
|
Really difficult to render through low quality web
video...
|
|
Advertising
commercials made using computer graphics techniques
|

|
ALARIS "MARTIENS"
Publicité pour un train
Contact : Sophie LHERAUD
GROUPE DAIQUIRI/SPAINBOX, ESPAGNE
Tel : (34) 91 413 42 40 - Fax : (34) 91 413 40 06
e-mail : spainbox@redestb.es
Production : DAIQUIRI DIGITAL PICTURES
Coproduction : LEE FILMS
Réalisation : Victor GARCIA
Computer graphics : Juan TOMICIC (DAIQUIRI/SPAINBOX) - 2000
Hard/Soft : SGI / Softimage, Maya, In-House, Henry, Flame
|
Animation series
a pilot or episode of a series. The quality of the screenplay will be
taken into account
|
Depending upon the year, a bit like the "Fiction" award |
|
Science (simulation, visualisation, research)
works concerned with simulation, data base exploration and the visualisation
or scientific or architectural phenomena
|
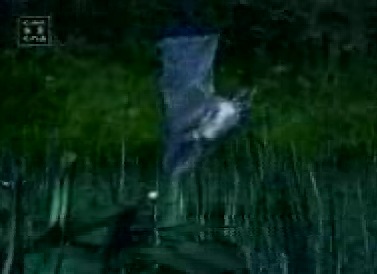
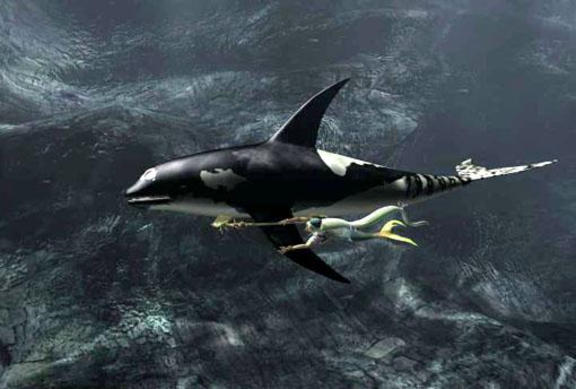
We will look deeper in that subject later on, here,
let's see that scientific visualisation may be really beautiful, let's
look at a bat.
|
CHIROPTERES VIRTUELS
Bat's behaviour
Contact : Michel GAURIAT
BETA PRODUCTION, France
Tél : (33) 2 48 24 42 30 - Fax : (33) 2 48 24 82 37
e-mail : beta.prod@wanadoo.fr
Production : BETA PRODUCTION
CoProduction : GREENSPACE PRODUCTIONS INC.
Réalisation/Infographie : Denis PONTONNIER (Association Imagénérie)
Hard./Soft. : PC, Lightwave
96 : The Visible Human Project
Production : NCAR's Scientific Computing Division
Réalisation : National Center Atmospheric Research
Réalisation infographique : National Center Atmospheric Research
Pays : Etats-Unis
|
Music Video
music-based clips incorporating computer graphics or special effects
sequences
|
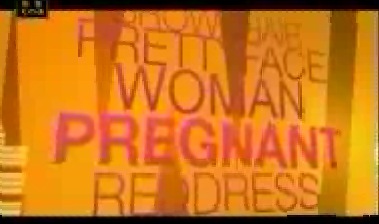
and what about a bit of Pink...
|
ALEX GOPHER "THE CHILD"
Réalisateur: Antoine BARDOU-JACQUET
Infographie: DURAN
Production: LE VILLAGE
Pays: France
96 : Titre : Rolling Stones " Like a Rolling
Stone "
Production : Midi Minuit Partizan
Réalisation : Michel Gondri
Réalisation infographique : Buf Compagnie
Pays : France : 96
|
Direct access to the list of winners
Palmarès
Prix Pixel-INA 1996
Palmarès Prix
Pixel-INA 1997
Palmarès Prix
Pixel-INA 1998
Palmarès Prix
Pixel-INA 1999
Palmarès
Prix Pixel-INA 2000
Slide 7 : Computer Aided Design
Computer Aided Design
Computer graphics has had a dramatic impact on the design
process. Today, most mechanical and electronic designs are executed entirely
on computer. Increasingly, architectural and product designs are also migrating
to the computer. Automated tools are also available that verify tolerances and
design constraints directly from CAD designs. CAD designs also play a key role
in a wide range of processes from the design of tooling fixtures to manufacturing.
CAD has had the follow impact on computer graphics.
-
Drives the high-end of the Hardware market
(Renault in France : bought lots of large
screen, work hand in hand with SGI)
-
Integration of computing and display resources
-
Reduced design cycles
-
Integration between the various crafts of a design lines
-
From CAD to Virtual Manufacturing
|
VLSI : Very Large Scale Integration:
designing electronic chips
|
|
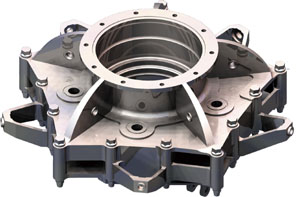
UGS : towards Virtual
Manufacturing
|
|
|
Credit: MICHAEL WESTFALL, MARTECH TECHNICAL SERVICES;
FAIRFIELD, CA
Date Created: 10/6/97
Software: AutoCAD and 3D Studio Max
AutoCad (AutoDesk)
|
Credit: MIKE JUSTICE, UNIVERSITY OF MIAMI SCHOOL
OF ARCHITECTURE
Date Created: 1/5/1999
Software: AutoCAD and 3D Studio Max R2
NB. : About architect : been told that some of them
did not like and use VR, because with that tool, their clients were able
to see defaults in their plan.
|
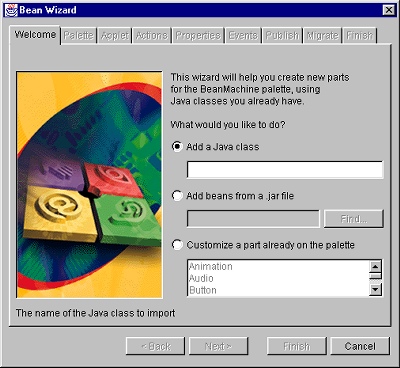
Slide 8 : Graphical User Interface : GUI
Graphical User Interface : GUI
Computer graphics is an integral part of every day computing.
Nowhere is this fact more evident than the modern computer interface design.
Graphical elements such as windows, cursors, menus, and icons are so common
place it is difficult to imagine computing without them. Once graphics programming
was considered a speciality. Today, nearly all professional programmers must
have an understanding of graphics in order to accept input and present output
to users.
From... the first operational Alto computer completed at Xerox PARC in 1973.
To ... January 5, 2000 : Apple announces Aqua, the new look for their
upcoming MacOS X client
And then Java and Swing
Slide 9 : presentation graphics
Presentation Graphics
All the "camembert" things (or more well known in English as "pie
chart", bar chart ....)
| Name |
Example |
What is it? |
Why use it? |
When to use it? |
| Pie Chart |
 |
A pie chart is a tool that helps you visualise the relative importance
of several categories of
a variable. |
To provide a rapid, graphical overview of data you have collected, such
as information
about different types of users, types of treatments, types of methods, etc.
|
When you have collected some data (for example, a counting of events or
a distribution of
values) and you want to graphically depict the data |
| Bar Graph |
 |
A bar graph is used to graphically present data that you have gathered.
The type of
data represented in a bar graph is the number of occurrences measured in
different
categories of data. A bar graph is often used to graphically represent the
information
you have gathered in a table. For example, in the bar graph below, you can
see a
comparison of the number of users of different services -- outpatient, inpatient,
and
other -- by type of service. |
It helps you visualise relationships among different categories of factors
affecting
services to the users. |
It is used when the information corresponds to a nominal scale (a counting
of
occurrences), and when you want to compare two or more groups (no more than
six). |
| Histogram |
 |
A histogram is a diagram that graphically depicts the variability in a
process or
procedure within your agency. When you want to see how a procedure is working
in your organisation, you can gather data about that procedure (such as
the amount
of time the procedure takes) and create a histogram. The histogram allows
you to see
the variation in the amount of time it takes to do that process. |
Discovering and displaying this variation will greatly increase the team's
knowledge
about a process. |
When you want to see the pattern of variation of a particular process,
such as when
you are describing a problem, or during data collection and analysis. |
| Line Graph |
 |
A line graph is a type of graph that represents data or sets of data that
have been
collected over a period of time. The data are plotted on a graph corresponding
to
standard intervals of time, and a line is drawn connecting the data points.
If updated
regularly, line graphs help managers to follow a trend over a period of
time and take
actions to manage the trend. |
A line graph allows managers or team members to see trends in data (increase,
decrease, or no change) over a period of time. This can be useful to help
you
visualise changes in the process over time or to let you compare the performance
before and after the implementation of a solution. |
To visualise a process during a specific period of time to help you describe
a
problem, or when you want to evaluate a solution to a problem. |
Slide 10 : Mediacal Imaging
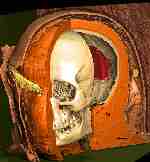
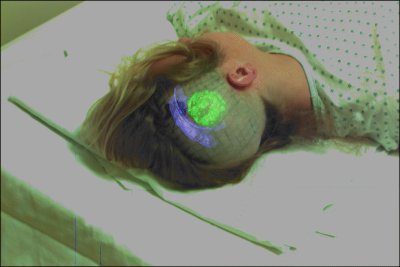
Medical Imaging
There are few endeavours more noble than the preservation
of life. Today, it can honestly be said that computer graphics plays an significant
role in saving lives. The range of application spans from tools for teaching
and diagnosis, all the way to treatment. Computer graphics is tool in medical
applications rather than an a mere artifact. No cheating or tricks allowed.
The Visible Human Project� is an outgrowth of the NLM's
1986 Long-Range Plan (US National Library of Medicine). It is the creation of
complete, anatomically detailed, three-dimensional representations of the normal
male and female human bodies. Acquisition of transverse CT, MR and cryosection
images of representative male and female cadavers has been completed. The male
was sectioned at one millimetre intervals, the female at one-third of a millimetre
intervals. The long-term goal of the Visible Human Project� is to produce a
system of knowledge structures that will transparently link visual knowledge
forms to symbolic knowledge formats such as the names of body parts.
Slide 11 : Scientific Visualization
Scientific Visualisation
Computer graphics makes vast quantities of data accessible.
Numerical simulations frequently produce millions of data values. Similarly,
satellite-based sensors amass data at rates beyond our abilities to interpret
them by any other means than visually. Mathematicians use computer graphics
to explore abstract and high-dimensional functions and spaces.
Physicists can use computer graphics to transcend the limits of scale. With
it they can explore both microscopic and macroscopic worlds.
From scientific visualisation to information visualisation
Image processing
From satellite camera
Analysing large amount of information (from real input or from simulation)
From geological data, data with intrinsic spatial signification
Visualising model
From mathematics, chemistry
abstract data and hierarchical data
From understanding to explanation
|
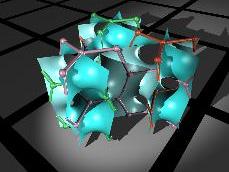
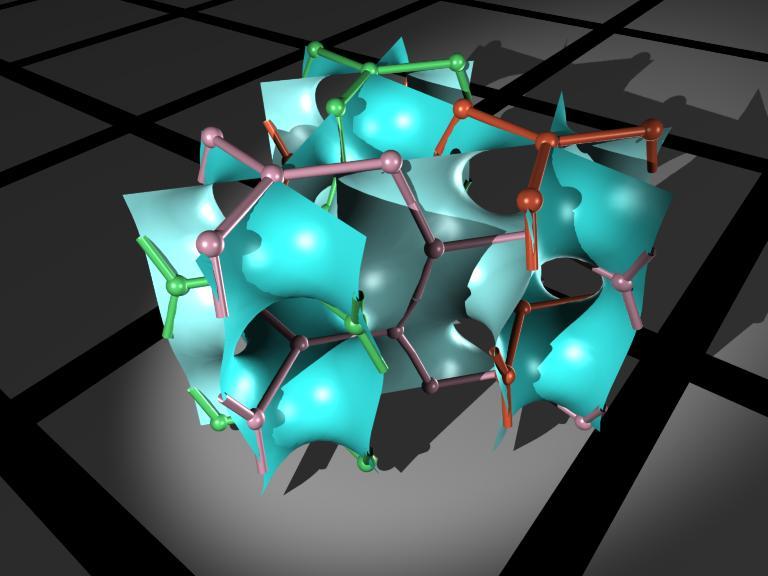
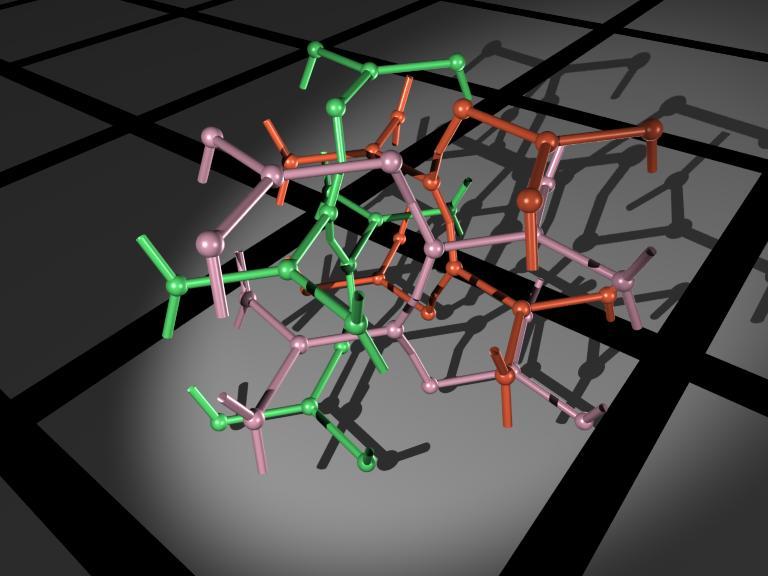
Triply connected graph embeddings
Minimal Surface graph embeddings resulting in interlocking disconnected
lattices
G-Surface
|
|

|
|
|
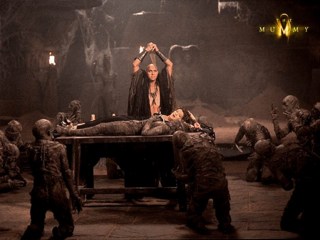
"The mummy is back"
Unwrapping a Mummy by Mouse Click
Institute of Mathematics and Computer Science in Medicine (IMDM)
University Hospital Eppendorf
University of Hamburg
Germany
|
As seen in "Jurassic Park"!
|
 |
Some good examples of Computer Graphics that can help science presentation
and understanding
At ANU :
Slide 12 : n Dimension
Slide 13 : Tools
The tools... that we will not be learning
Paint and Imaging packages
Adobe Photoshop, Macromedia Fireworks, Flame (Video painting)...
CAD packages
AutoCAD
Rendering packages
Lightscape, Lightwave, Maya, PovRay, Carrara - MetaCreations ...
Lightscape : Radiosity (Vs Ray Tracing)
Modeling packages
3D Studio MAX, Maya, Softimage
Animation packages
Digimation, Marionette, Maya,
Graphics Modeling and Languages
RenderMan
Scientifics visualisation
IDL, Mapple
Graphics APIs
OpenGL, OpenInventor, VRML, Java3D
Slide 14 : Some Demos
Some Demos
MacOSX Interface
EarthBrowser is an easy and intuitive program to let you
get a “hands on” experience of our earth. Current weather conditions
and forecasts, real-time earthquake notifications, current cloud cover and webcam
images from around the globe make EarthBrowser more than just a 3-D model. The
constantly changing information in EarthBrowser makes it a unique tool showing
that the earth is truly alive.
Explore vast geometric worlds inhabited with beautiful
shapes in constant motion. Your tranquility experience is customized by our
TQworld net-servers creating thousands of visual and audio elements. No two
games are the same, and all games are designed to fit your playing style. As
it is in real life, achieving tranquility is a challenge. You’ll need to
use your mind, your heart and soul to navigate the game, but you’ll be
rewarded with a calming sensation that lasts long after you play.
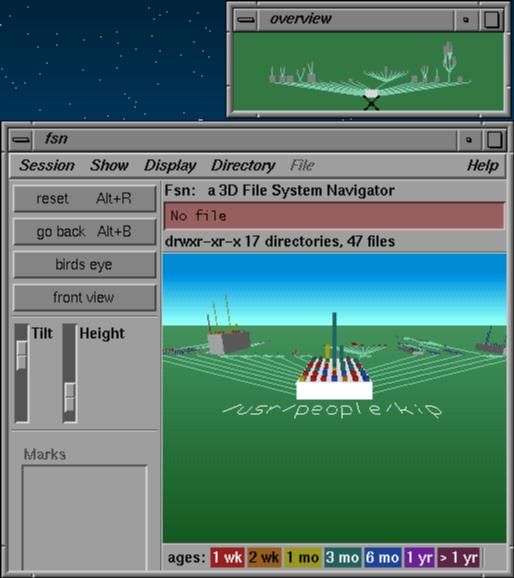
File system browser that utilizes three dimensions to
view directory hierarchies. It supports a full range of file system actions,
such as copying, labeling, creating new folders, and ejecting disks.3DOSX was
developed using Cocoa and Carbon routines to gain access to the file system,
and OpenGL for display. The “cool” part of 3DOSX is the new paradigm
of computing interfaces that it represents. While there is admittedly a ways
to go before 3DOSX becomes as quick and clean as the current Finder in terms
of workflow efficiency, we feel that the user experience will in time lead to
a better way of interacting with files. A lot of what 3DOSX is based upon could
be called “eye-candy”, but one must explore the program’s features
to truly appreciate what it can do for the average user. 3DOSX is the first,
the only 3D filesystem browser that doesn’t suck.
Atom in a Box is an application that aids in visualizing
the Hydrogenic atomic orbitals, a prime and otherwise unwieldy example of quantum
mechanics. Unlike other tools in this category, this program raytraces through
a three-dimensional cloud density that represents the wavefunction’s probability
density and presents its results in real-time (over 48 frames per second on
the latest hardware).


